Jean Thioulouse and François Chevenet
Laboratoire de Biométrie, Génétique et Biologie des Populations
URA CNRS 2055, Université Lyon 1
69622 Villeurbanne Cedex, France.
Abstract: We present NetMul, a World-Wide Web (WWW) interface for multivariate analysis. NetMul uses a WWW client to provide a graphical user interface (GUI) to the computational part of a subset of the ADE-4 multivariate analysis system. This allows to completely separate the GUI from the computational part of NetMul. The computational part is written in ANSI C and runs on a WWW server (a Unix workstation). The WWW client connects to this server and displays HTML (HyperText Markup Language) forms through which the user can set the parameters of the analysis that he wants to perform. Input (data) and output (factor scores) files are easily transferred to and from the server. Graphical outputs (factor maps) are drawn directly in the WWW client window. This system provides a multi-platform compatibility layer over a wide range of computer hardware and operating systems.
Keywords: Multivariate analysis; Graphical user interface; Portability; Computer networks; World-wide web.
1. Introduction
The development of graphical user interfaces (GUI) for computer operating systems and desktop software is a general trend of today computer industry. X-Windows (with Motif and OpenLook), Microsoft Windows, Apple Macintosh Finder, are examples of this development. Statistical software has followed this route (see for example Liu et al., 1995), with the consequence that the portability between different operating systems has become a difficult problem. Porting the computational part of statistical software, and particularly multivariate analysis, is easy as long as it is written in a standard language (Fortran, C, etc.), but making a portable GUI is a much more difficult task.
Here, we wish to underline the possibilities offered in this field by the standardization of computer network protocols. Thanks to protocol standardization, network applications (such as electronic mail or news readers, file transfer applications, or terminal emulation software) are now able to exchange information independently from the operating system on which they run. The World-Wide Web (WWW, Berners-Lee et al., 1992) is a "wide-area hypermedia information retrieval initiative aiming to give universal access to a large universe of documents." WWW client software, able to browse through the large amount of information provided by the servers, are available on all the major computer systems. HTML (HyperText Markup Language) is the language used to build WWW documents. This language includes the definition of special tags that allow the creation of simple user interface elements like buttons, menus, and editable text fields.
We have used these possibilities to create a user interface to a subset of the ADE-4 multivariate analysis software package (Thioulouse et al., 1995). This user interface is called NetMul, and it can be used at the following URL (uniform resource locator):
http://biomserv.univ-lyon1.fr/NetMul.html
The server is currently a Sun SparcStation 2 running SunOS 4.3.
ADE-4 is a multivariate analysis software for Macintosh microcomputers. The documentation and downloading access is at:
http://biomserv.univ-lyon1.fr/ADE-4.html
2. NetMul user interface
NetMul can be used to perform four types of multivariate analysis methods: principal component analysis (PCA) for quantitative variables (Hotelling, 1933), correspondence analysis (COA) for contingency tables (Williams 1952, Benzécri 1973), multiple correspondence analysis (MCA) for qualitative (discrete) variables (Nishisato, 1980; Tenenhaus and Young, 1985), and principal coordinate analysis (PCO) for distance matrices (Manly, 1994). The other options in NetMul are interpretation helps, that allow to perform the inertia analysis of rows and columns (decomposition of the total variance on each axis), to compute a data table reconstitution with some number of axes and the residuals between this reconstitution and original data, and to compute factor scores for additional rows and columns not taken into account in the analysis (see Lebart et al. 1984 for a detailed description of these points).
Before using NetMul, the user must first transfer the data table to the server. This can be done either by using the "Post Data" form and pasting the data table into the text field, or by anonymous FTP (file transfer protocol) to the following URL:
ftp://biom3.univ- lyon1.fr//pub/NetMul/data
The data files and all the output files are created in the same directory, and they can be retrieved with the WWW client or by anonymous FTP.
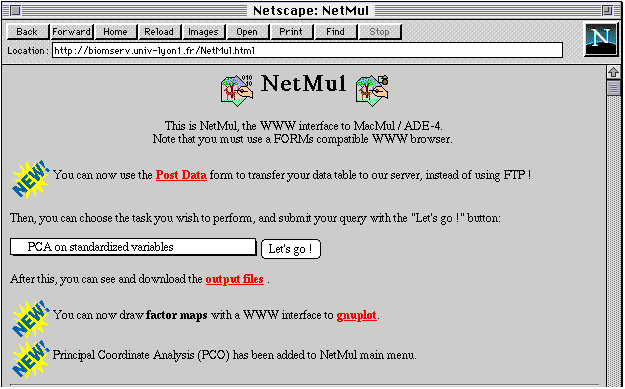
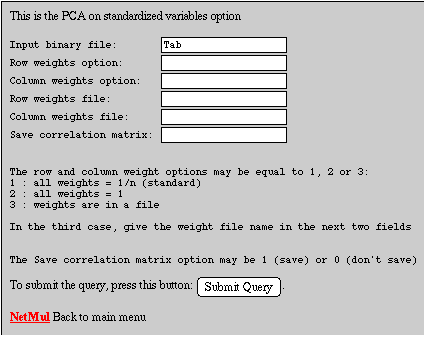
Figure 1 shows the heading of NetMul home page with the main menu from which the user can choose the task he wants to perform. After clicking on the "Let's go !" button, the user is presented with a fill-out form, which content depends on the option selected in the main menu. Figure 2 shows the form corresponding to the PCA on standardized variables option. Once this form is filled out, the "Submit Query" button can be used to start the computations, and a text report is subsequently generated. This report is displayed in the WWW client window and it can be copied and pasted into other applications. The resulting factor scores are stored in two files in the same directory as the data file.
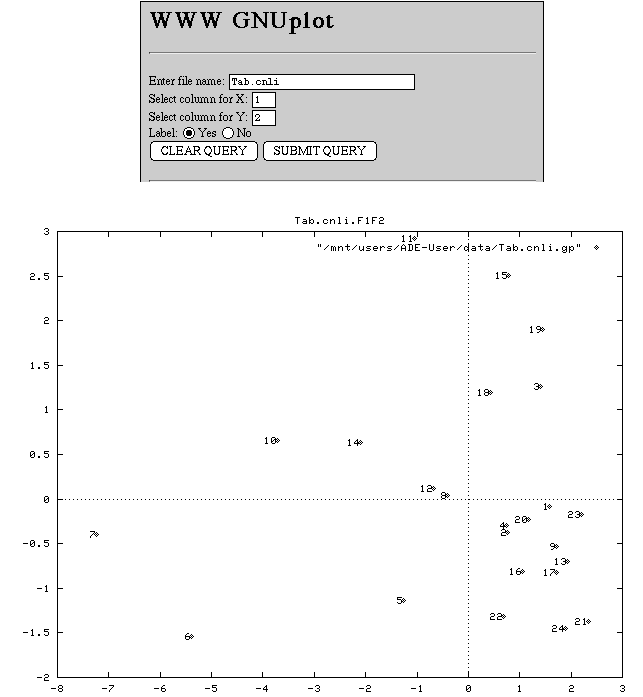
A graphical display of principal axes (factor map) can be drawn with a special form that offers a WWW interface to the gnuplot program (from the free GNU package). This form can be accessed through the "gnuplot" hyper link (Figure 1).

Figure 1. Screen shot of NetMul home page. The "Post Data" hyper link allows to transfer the data table to the server. The main menu is set to "PCA on standardised variables", so the "Let's go !" button leads the form shown in Figure 2. The "output files" hyper link gives access to the directory where all the files are stored. The "gnuplot" hyper link leads to the gnuplot form (Figure 3).

Figure 2. This is the "PCA on standardized variables" form. Only the first field ("Input binary file") is required. The default row weight is 1/n for all rows (n being the number of rows) and the default column weight is 1 for all columns (usual PCA). The "Submit Query" button starts the computations and the "NetMul" hyper link gets back to NetMul home page (Figure 1).
3. Example of use
A small example of use is presented here. The data set is a table containing ten physico-chemical variables measured 24 times along a French stream (Thioulouse and Chessel, 1987), on which we are going to perform a simple (standardized) PCA. Variables are in columns and samples in rows.
A forms compatible WWW client is used to connect to NetMul home page. The first step is to paste the data table into the Post Data form to send it to the server, giving it the name "Tab". The second step is to choose the "PCA on standardized variables" option from the main menu. The corresponding form is presented in Figure 2. Only the first field (Input binary file) must be filled-out, all the others will have convenient default values.
A mouse click on the "output files" hyper link (Figure 1) produces a display of the contents of the /pub/NetMul/data directory. A number of files have been created, among which files "Tab.cnli" and "Tab.cnco" respectively contain the row and column scores. See the ADE-4 documentation for more information about output files. The factor map can be obtained very easily with the "gnuplot" hyper link (Figure 3).
4. Conclusion
NetMul is still a prototype application, and could be improved in several ways. Nevertheless, it provides a good idea of the advantages provided by a GUI that is totally system independent. Indeed, the computation code for multivariate analysis that runs on the server is completely isolated from the user interface code. Conversely, the graphical user interface is available on all the current computer systems supporting a TCP/IP connection and a WWW client, which includes most Unix workstations, IBM PC or compatible microcomputers running Microsoft Windows, and Apple Macintosh. From the point of view of the WWW server, the computation code can be easily ported to any computer with an ANSI C compiler and a WWW server software, which also includes almost all usual computer systems. Moreover, the HTML scripts that allow to build the user interface items are very easy to write.
We intend to add more functions to NetMul by incorporating other modules from the ADE-4 package (for example discriminant analysis, two-tables coupling methods like co-inertia analysis and canonical correspondence analysis, PLS regression, or three-way table methods).

Figure 3. The gnuplot interface form (top) and an example factor map (bottom). The user can choose the file from which the coordinates are read and the column numbers in this file for the X and Y axes. If the Label option is selected, each element number is drawn on the graphic.
References
Benzécri, J.P., L'analyse des données. II L'analyse des correspondances. (Bordas, Paris, 1973).
Berners-Lee, T.J., R. Cailliau, J.F. Groff, and B. Pollermann, World-Wide Web: The Information Universe, in: Electronic Networking: Research, Applications and Policy, Vol. 2 (Meckler Publishing, Westport, CT, USA, 1992) 52-58.
Hotelling, H., Analysis of a complex of statistical variables into principal components. Journal of Educational Psychology 24 (1933) 417-441 , 498-520.
Lebart, L., L. Morineau, and K.M. Warwick, Multivariate descriptive analysis: correspondence analysis and related techniques for large matrices. (John Wiley and Sons, New York, 1984).
Liu, L.M., K.K. Chan, A.L. Montgomery, and M.E. Muller, A system independent graphical user interface for statistical software, Conmputational Statistics and Data Analysis, 19 (1995) 23-44.
Manly, B.F., Multivariate Statistical Methods. A primer. (London, Chapman and Hall, 1994)
Nishisato, S., Analysis of caregorical data : dual scaling and its applications. (University of Toronto Press, London, 1980).
Tenenhaus, M. and F.W. Young, An analysis and synthesis of multiple correspondence analysis, optimal scaling, dual scaling, homogeneity analysis and other methods for quantifying categorical multivariate data. Psychometrika 50 (1985) 91-119.
Thioulouse, J. and D. Chessel, Les analyses multi-tableaux en écologie factorielle. I De la typologie d'état à la typologie de fonctionnement par l'analyse triadique. Acta Œcologica, Œcologia Generalis 8 (1987) 463-480.
Thioulouse J., S. Dolédec, D. Chessel, and J.M. Olivier, ADE software: multivariate analysis and graphical display of environmental data, in: G. Guariso and A. Rizzoli (Eds.), Software per l'ambiente (Pàtron editore, Bologne, 1995) 57-62.
Williams, E.J., Use of scores for the analysis of association in contingency tables. Biometrika 39 (1952) 274-289.